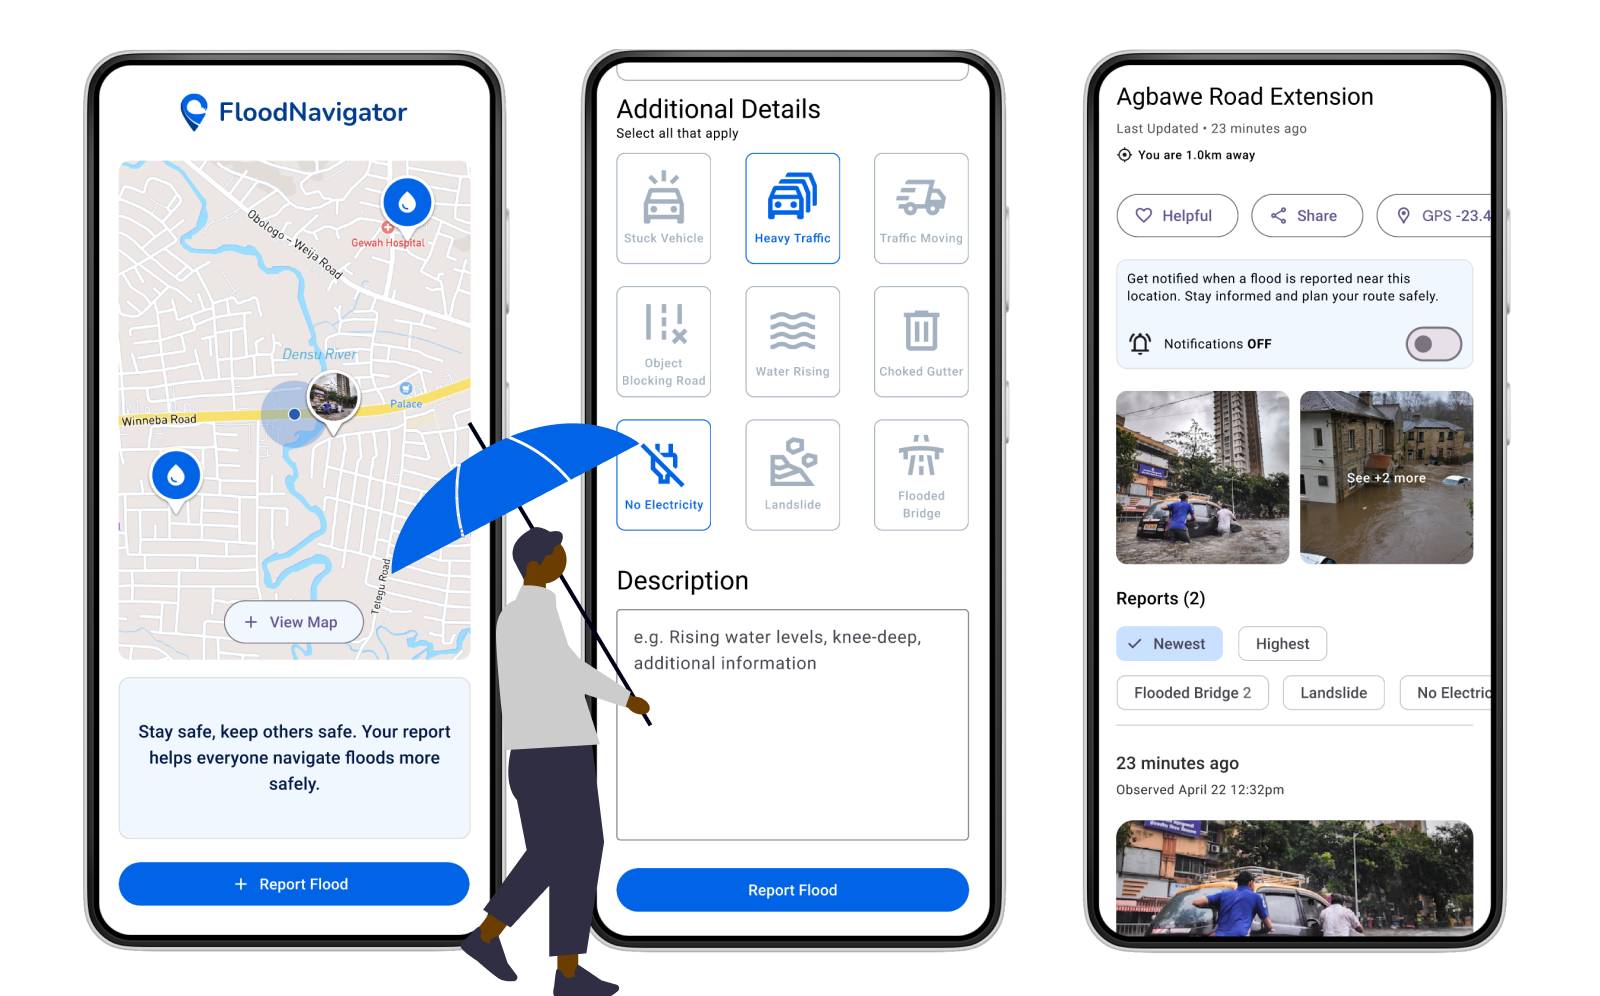
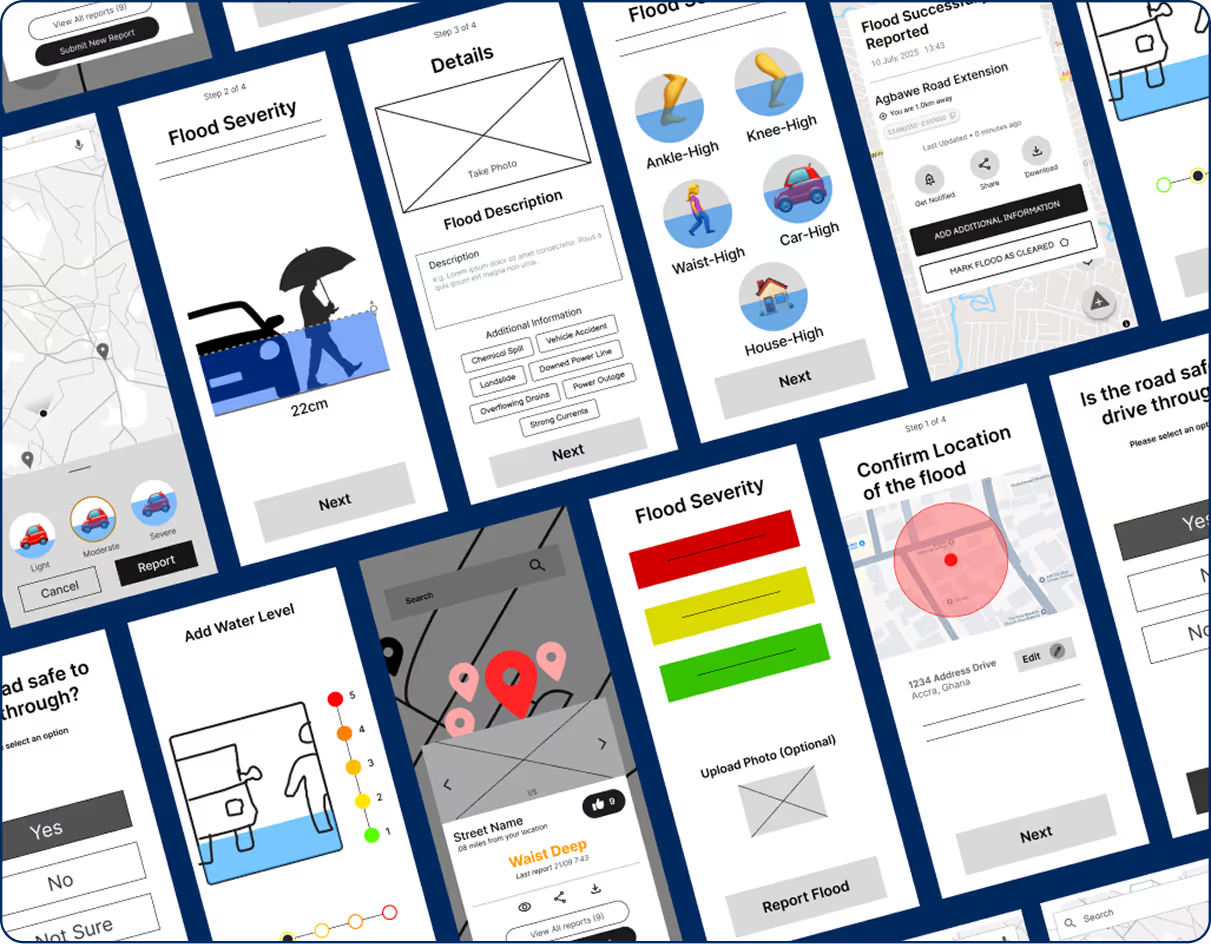
FloodNavigator
I co-founded and led the design of FloodNavigator, a web app that provides real-time, crowd-sourced flood information to communities in Ghana, Africa.
TIMELINE
5 Months
ROLE
Lead Product Designer
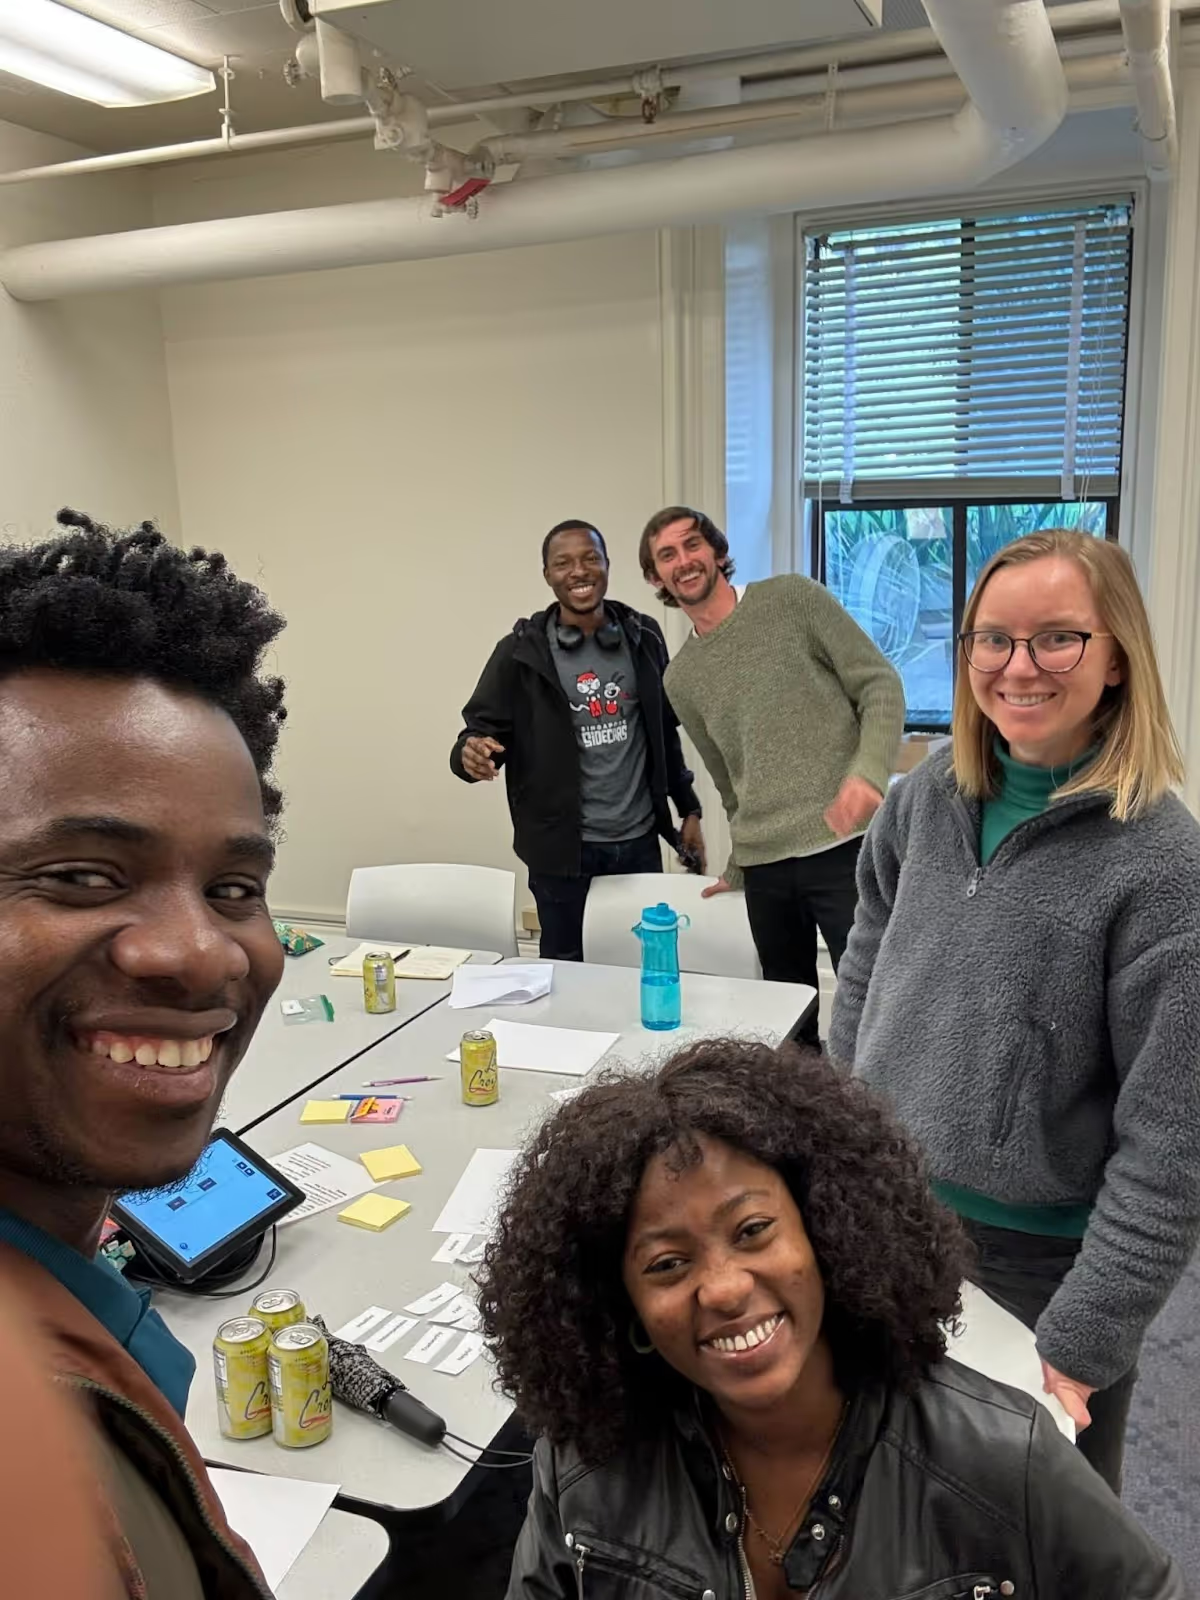
Team
1 Product Designer
1 Product Manager
1 UX Researcher
1 Data Analyst
2 Developers
1 Product Manager
1 UX Researcher
1 Data Analyst
2 Developers
Tools
Figma
Figjam
Dovetail
Slack
Notion


%201.svg)
%201.svg)
%201.svg)
%201.svg)
%201.svg)